The purpose of the analytics report is to give insights into the activity of the attendees.
- Setting the date range
- Export event report
- Event engagement
- Pages
- Objects
- Attendees (export CME report)
- Feed
- Searches
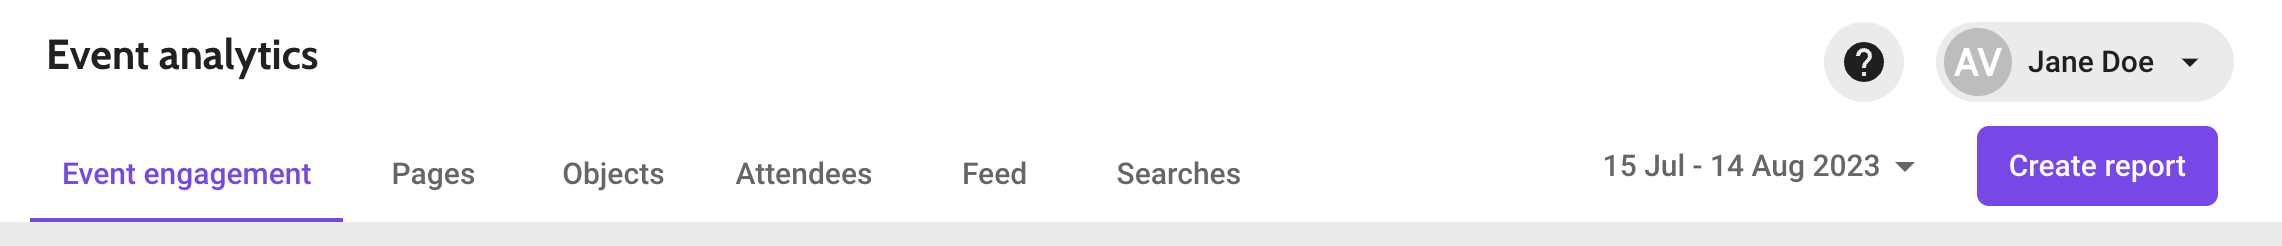
Setting the date range
In the tab bar at the top, click the current period to change the date range of your report.
You can choose a period from a few presets or select a Custom date range with the date pickers. Click Apply to show the data.
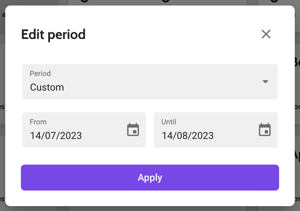
After the report has been generated, the dates in the tab bar are updated. This way you can see what date range your report is about if you visit the page later.
Export event report
In the purple, bar click the button Create report to download an Excel sheet with the event analytics of the selected period. You will first get a notification that the export started:
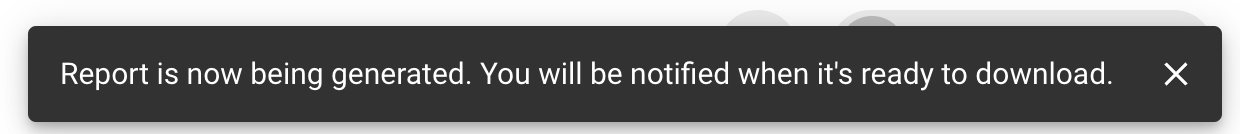
This is followed by an alert below the tab bar with the download link:

Event engagement
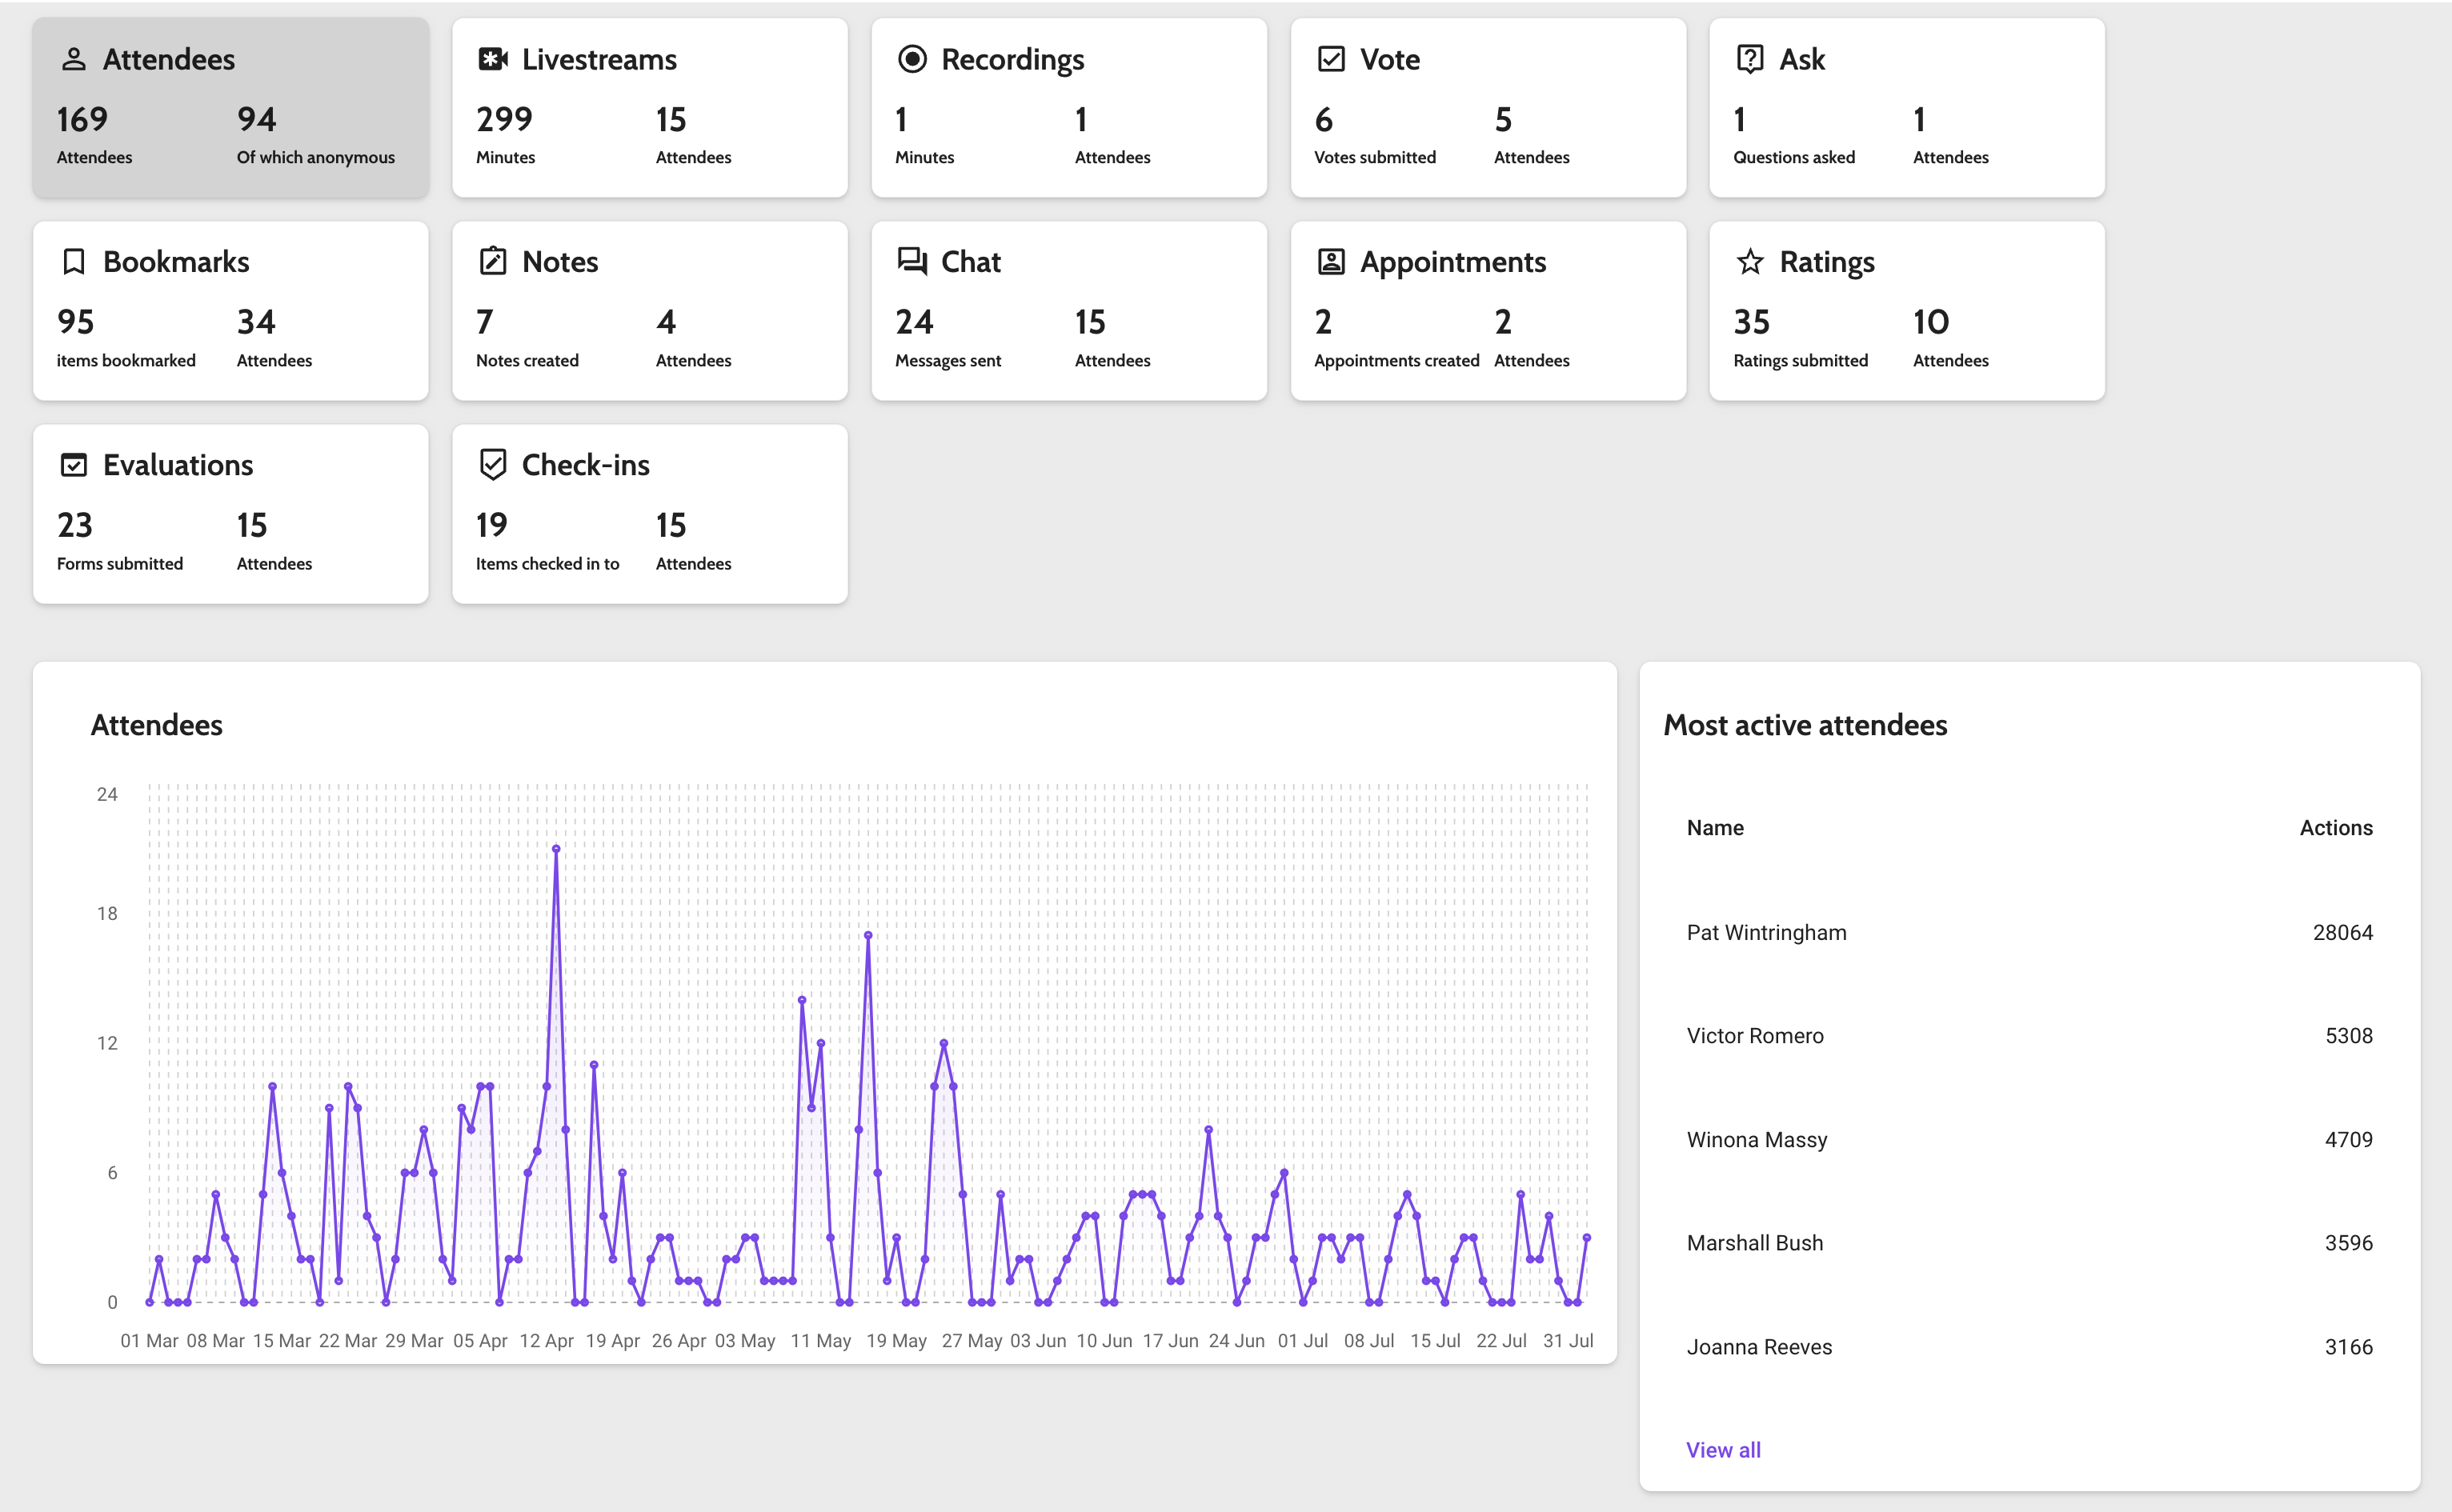
The event engagement is split into different actions, for example the number of livestream minutes watched or the number of chat messages sent. Each of these actions has its own card containing a total number, and the number of attendees contributing to this number.
All cards can be clicked to open a graph with actions per day and a top-5 table.
- Hover over graph to see the number per day.
- View all redirects to a full table containing all items, sorted by number.
- Clicking one item in the top-5 or full table opens a single item, for example, a programme item or user.
Notes
-
Attendees: the number of unique attendees of this event within the selected timeframe, and which of those did not sign in. A unique attendee is a person that accessed the web or mobile app at least once during that day. Find more information on anonymous attendees here.
-
Bookmarks: the total number of times an item was saved and the number of attendees that saved at least 1 item. Please note that saving an item adds +1 to this, and un-saving is -1.
Pages
This includes the following type of pages, that have been viewed at least once:
- Pages & Structure
- Landing page (web app), Home feed (mobile app)
- Attendee list
- Social wall
- My favourites
- My achievements
- My notes
- My contacts
- My sessions (web app)
Note that the intro page and carousel page can be found on the Feed tab.
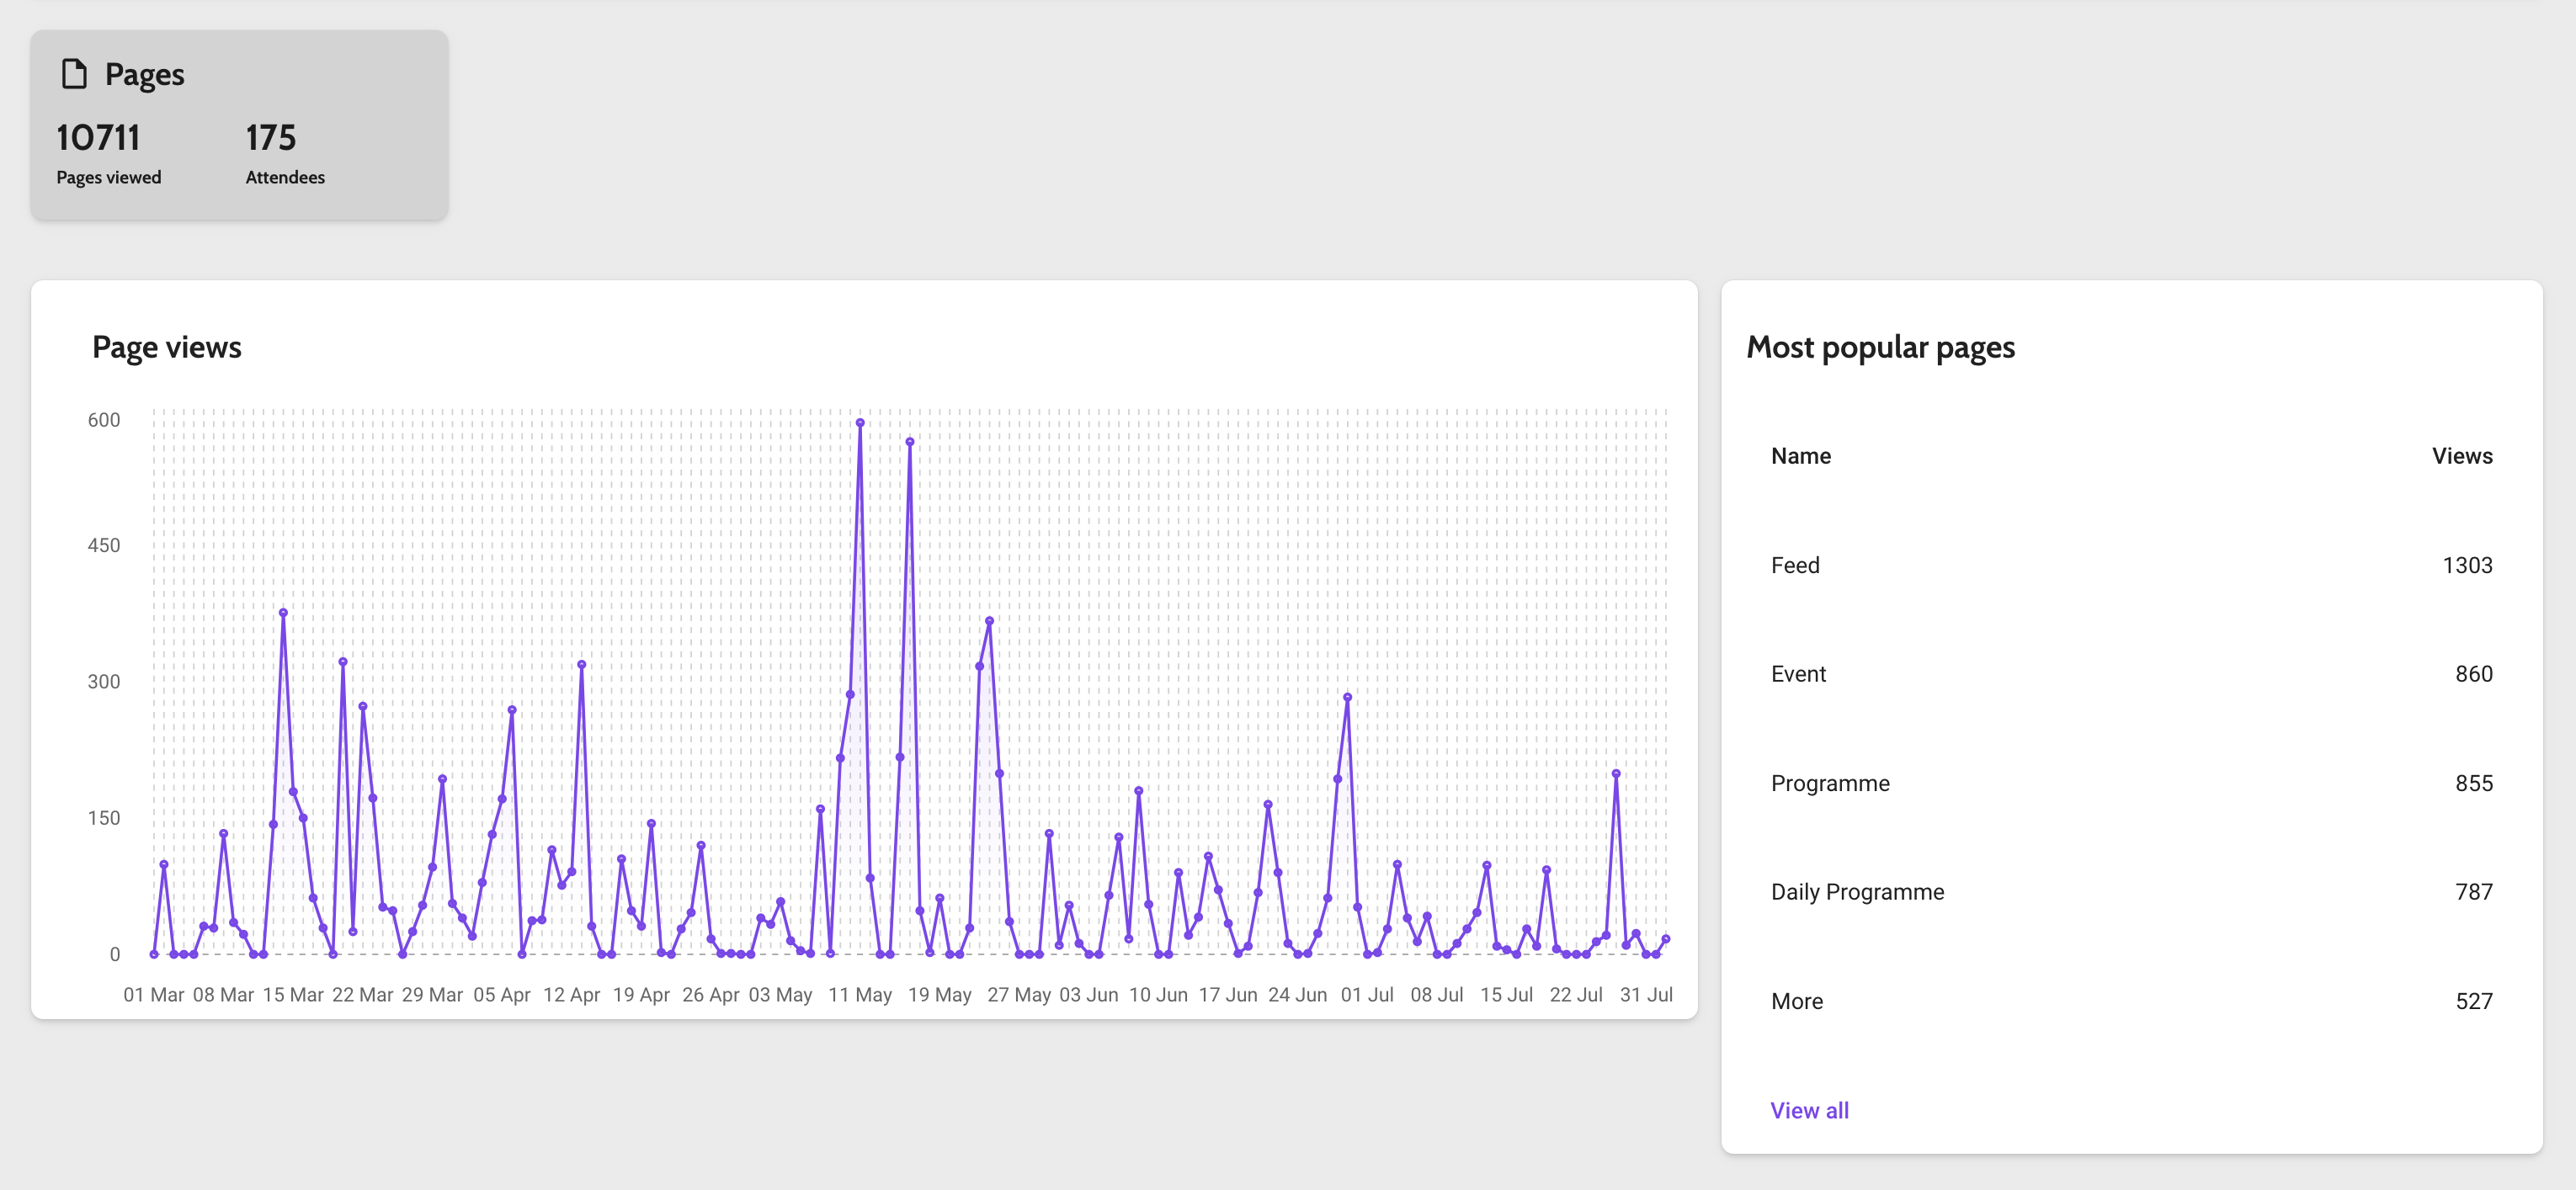
The card can be clicked to view a graph with page views per day and a top 5 table.
- Hover over on the graph to see the number per day.
- View all redirects to a full table containing all pages, sorted by the number of views. Per page, you will find the page name, type, total views, and the total number of attendees viewing the page.
- Clicking one page in the top 5 or full table opens the details of that page. It shows you a list of attendees who viewed the page, and how many times.
Objects
On this tab, you can see the most popular items at the event grouped into 5 categories: Programme items, Posters, Institutions, Persons, and Classifiers.
Every card contains the total number of views and how many attendees viewed an object of this category at least once. The card can be clicked to view a graph with page views per day and a top 5 table.
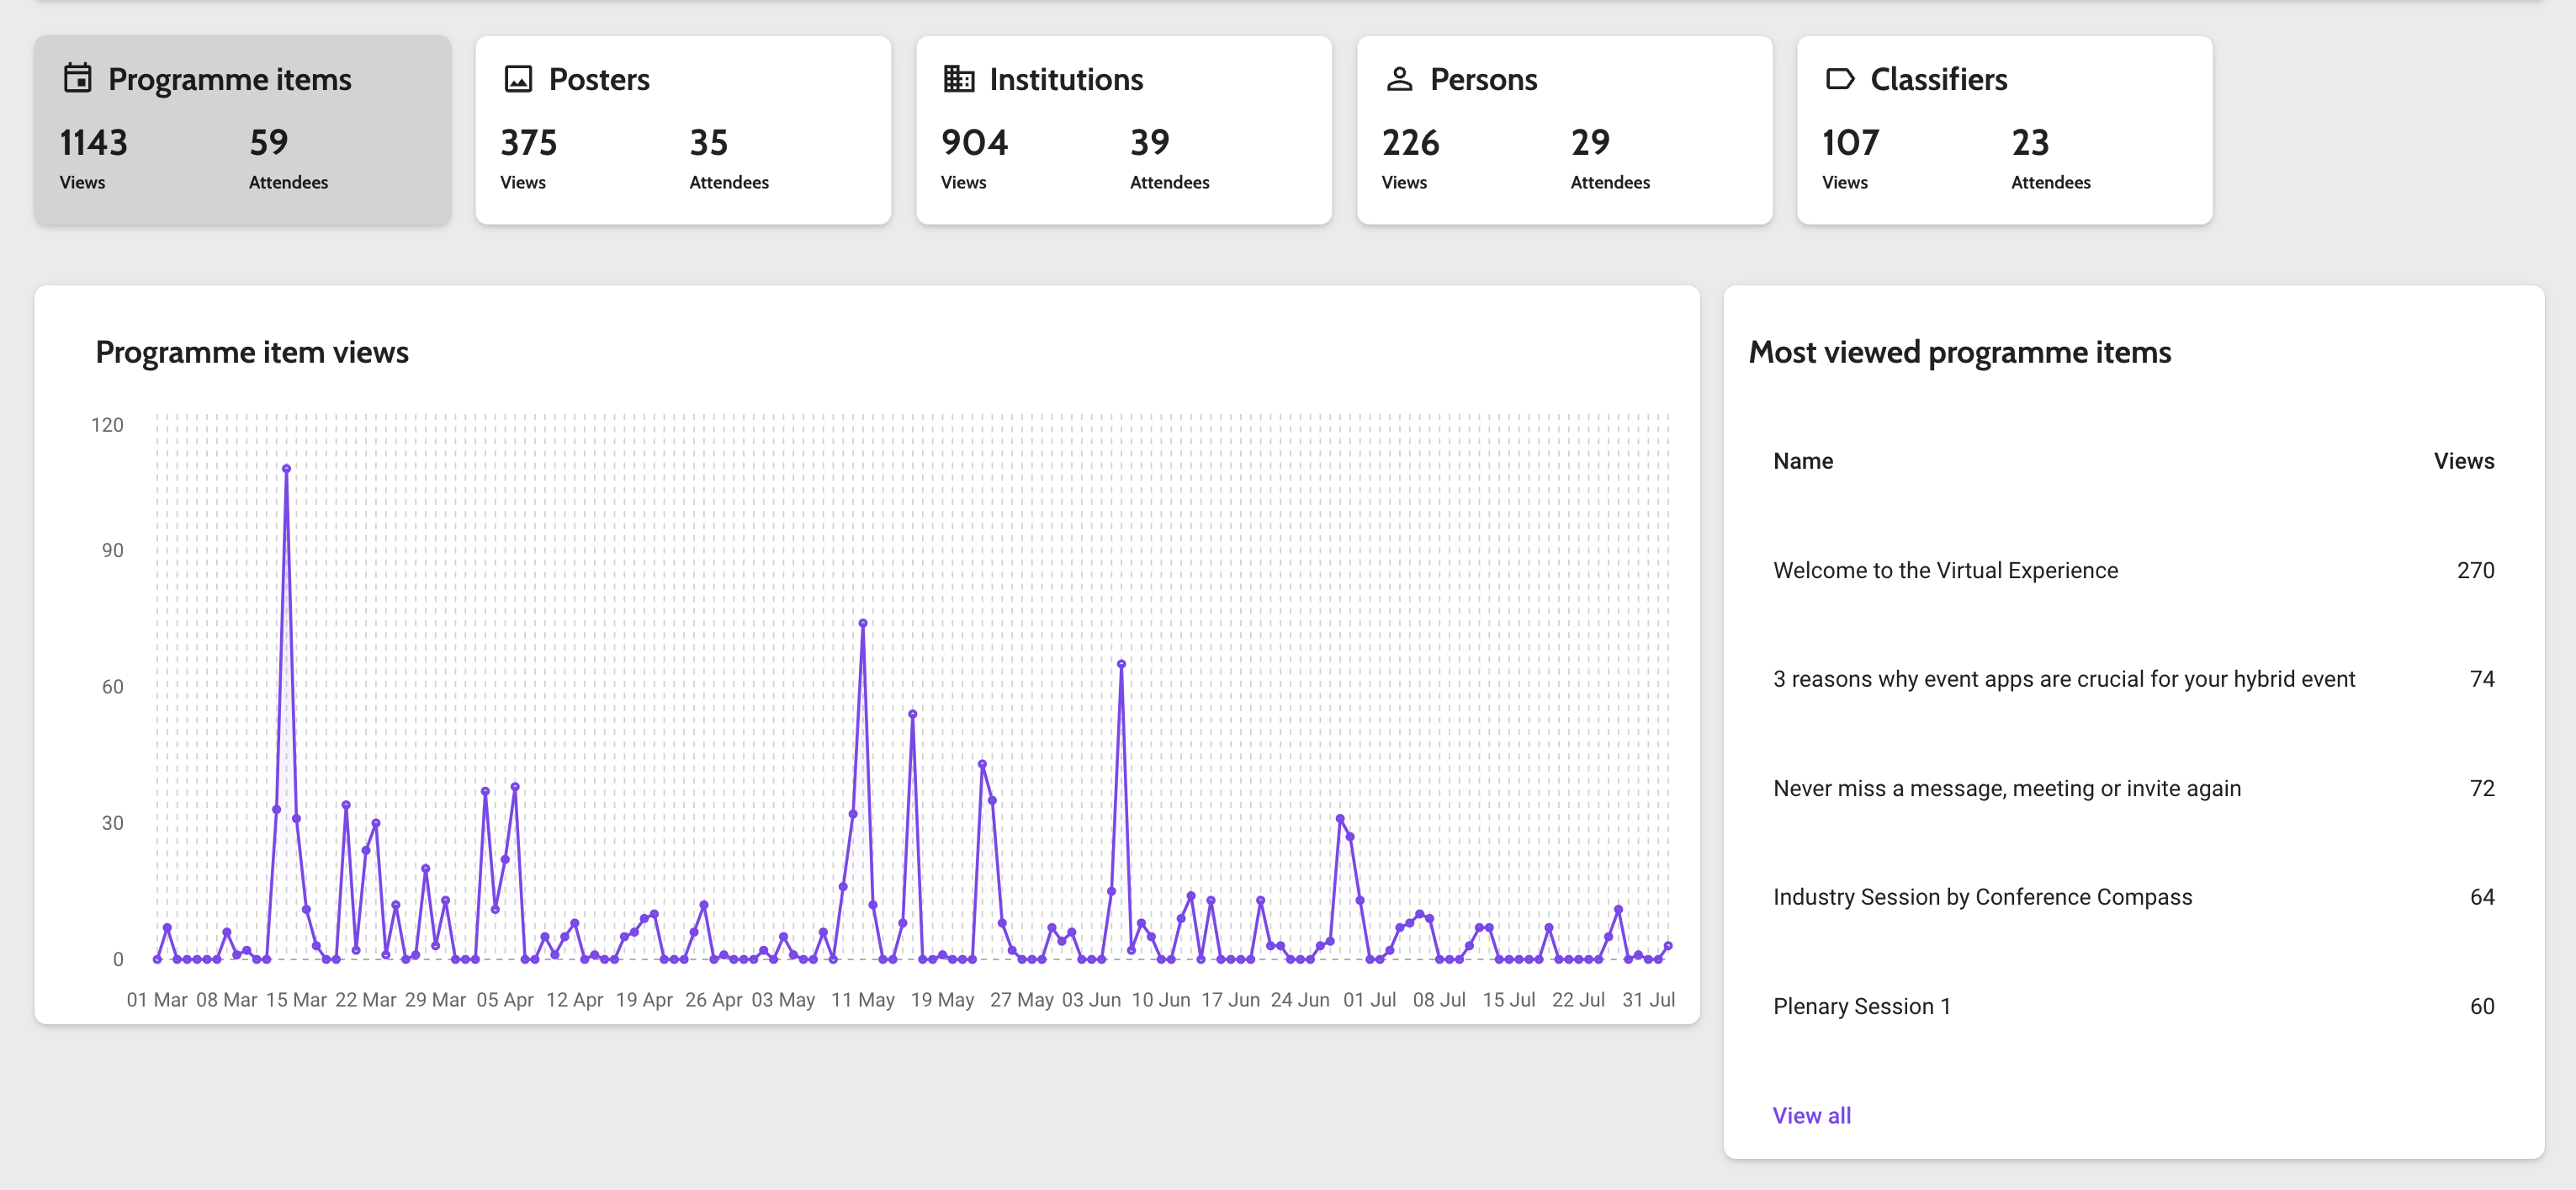
Clicking one item in the top-5 or full table opens the detail page of that object. Here you will find an overview of all actions related to this item (see screenshot below).
Click the button Export [object type] to download the results in an Excel sheet.
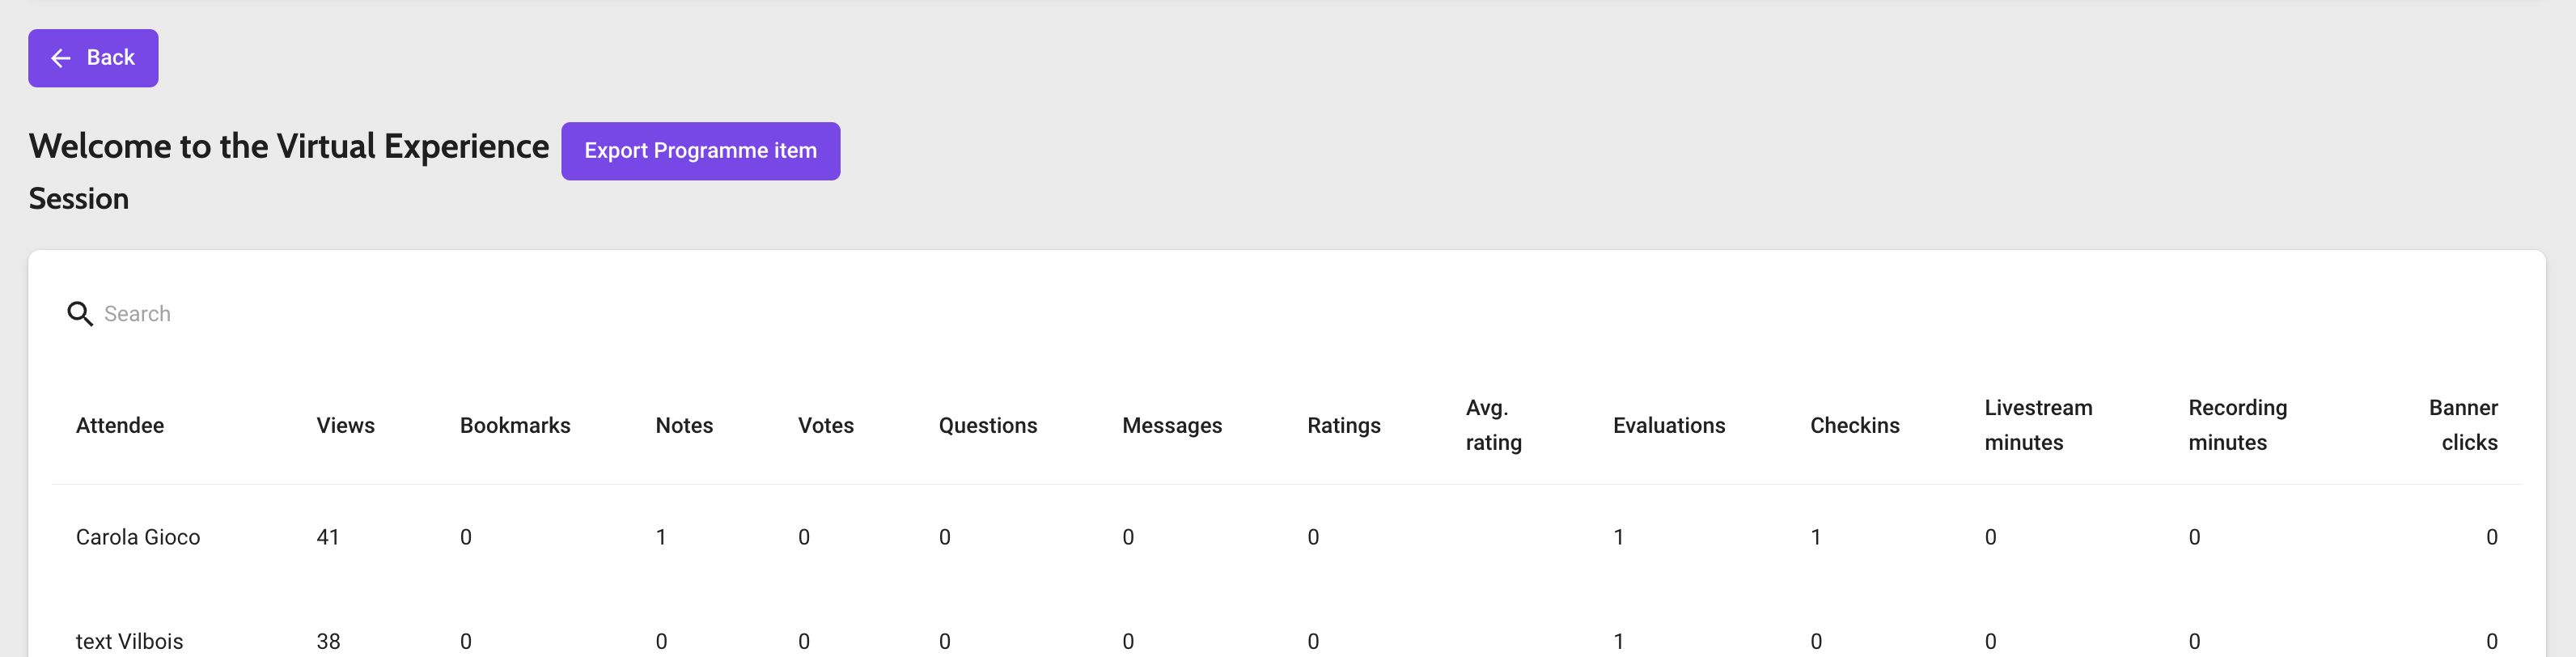
For virtual events, you can create an export of a specific session to get engagement details. The export will contain all attendees interacting with it and for example the number of live stream or on-demand recording minutes.
Attendees
On the attendee's tab, you'll find an overview of all active attendees within your web and/or mobile app. Please note that an attendee viewing the web app on mobile counts as a web attendee.
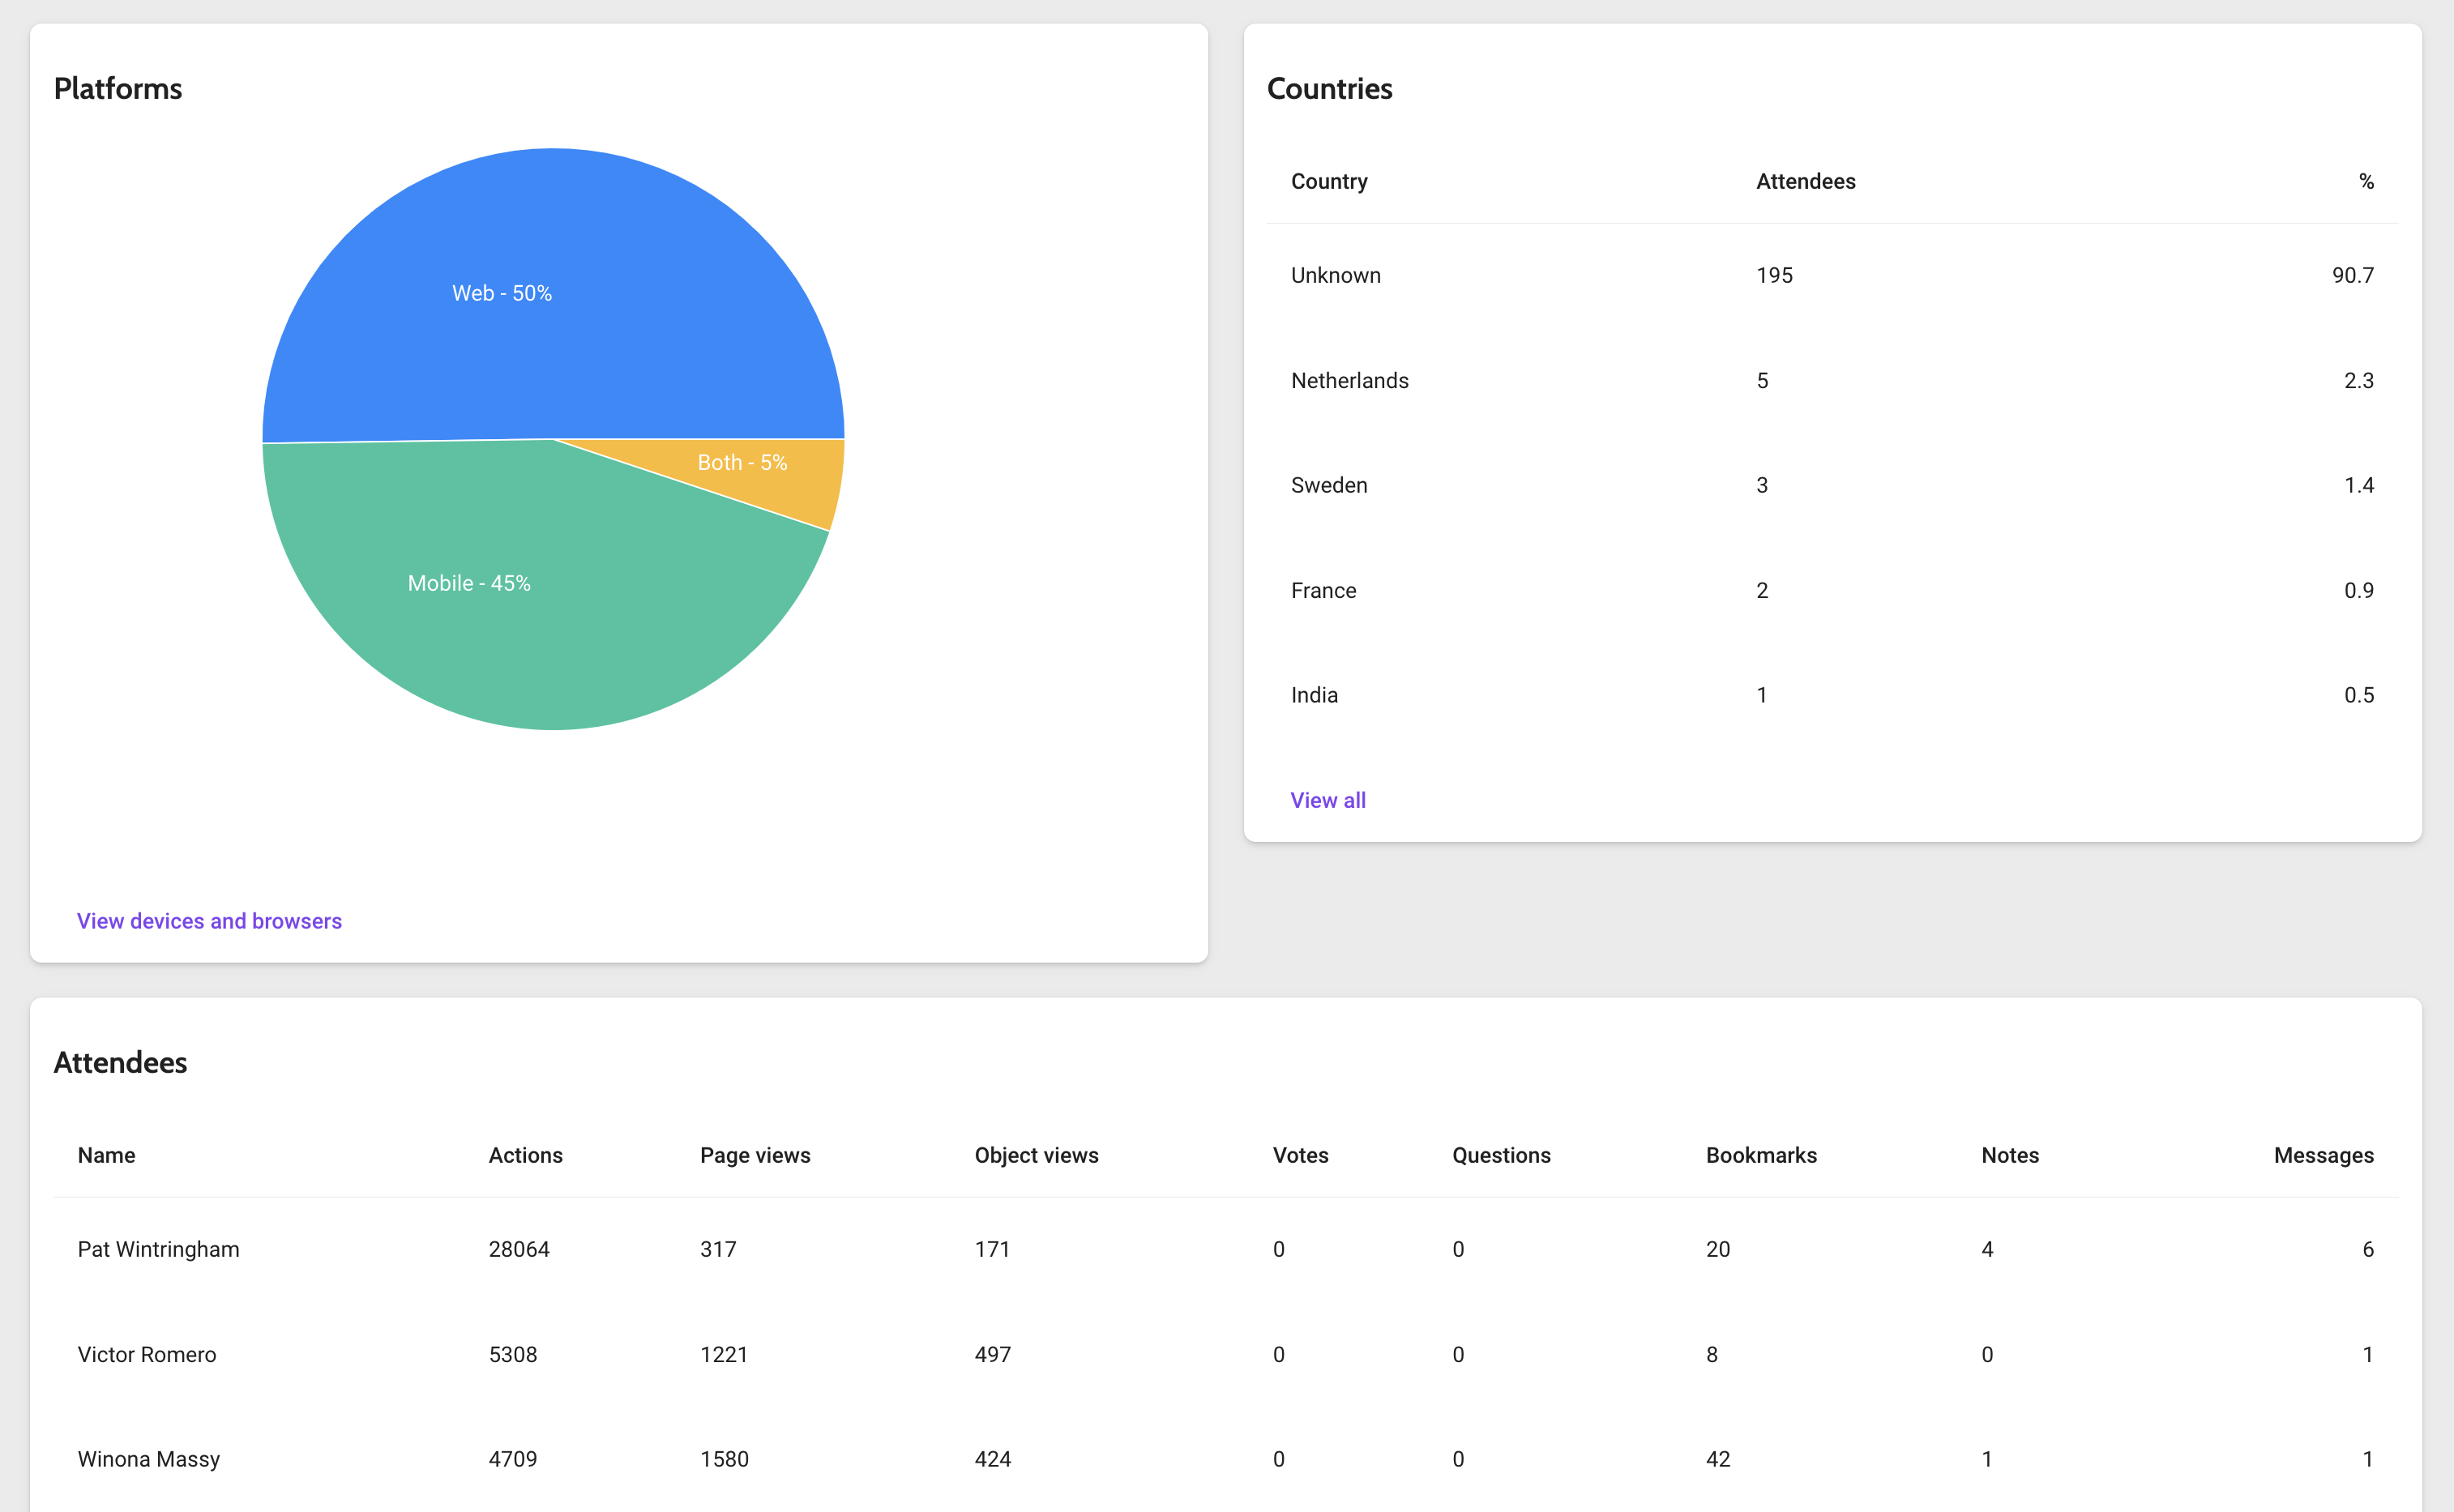
- Platforms: list the percentage of attendees that used the web app, mobile app or both.
- Countries: if attendees have filled in a country in their profile, you can see that here.
- Attendees: this table contains the 5 most active attendees. Click View all to see a list of all attendees.
In the list that opens when clicking View all, you can view (or export) the data of any attendee: which pages and objects he or she viewed, which objects were favourites or rated, etc.
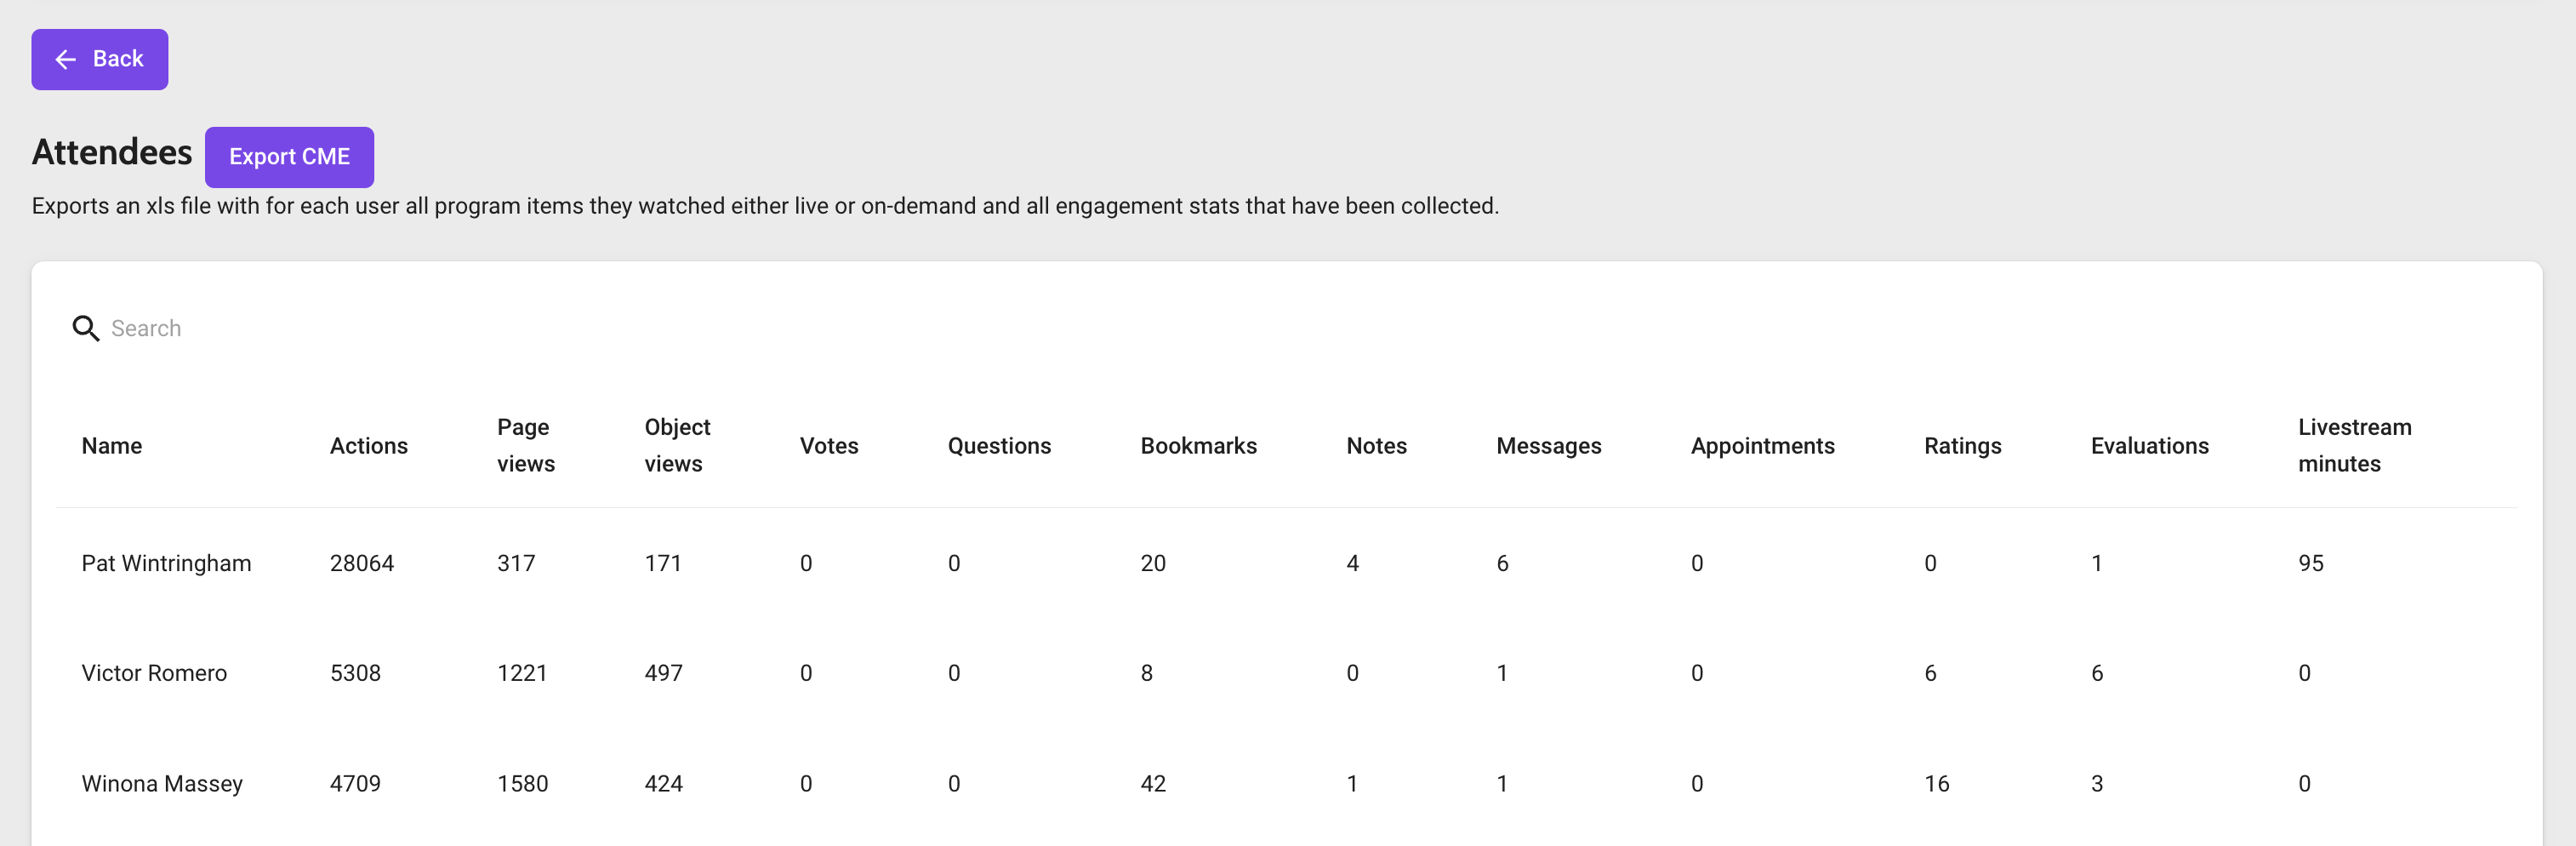
Click Export CME to create a sheet that contains an overview of all virtual sessions and their attendees. For every attendee-session combination, the number of live stream minutes and recording minutes is listed.
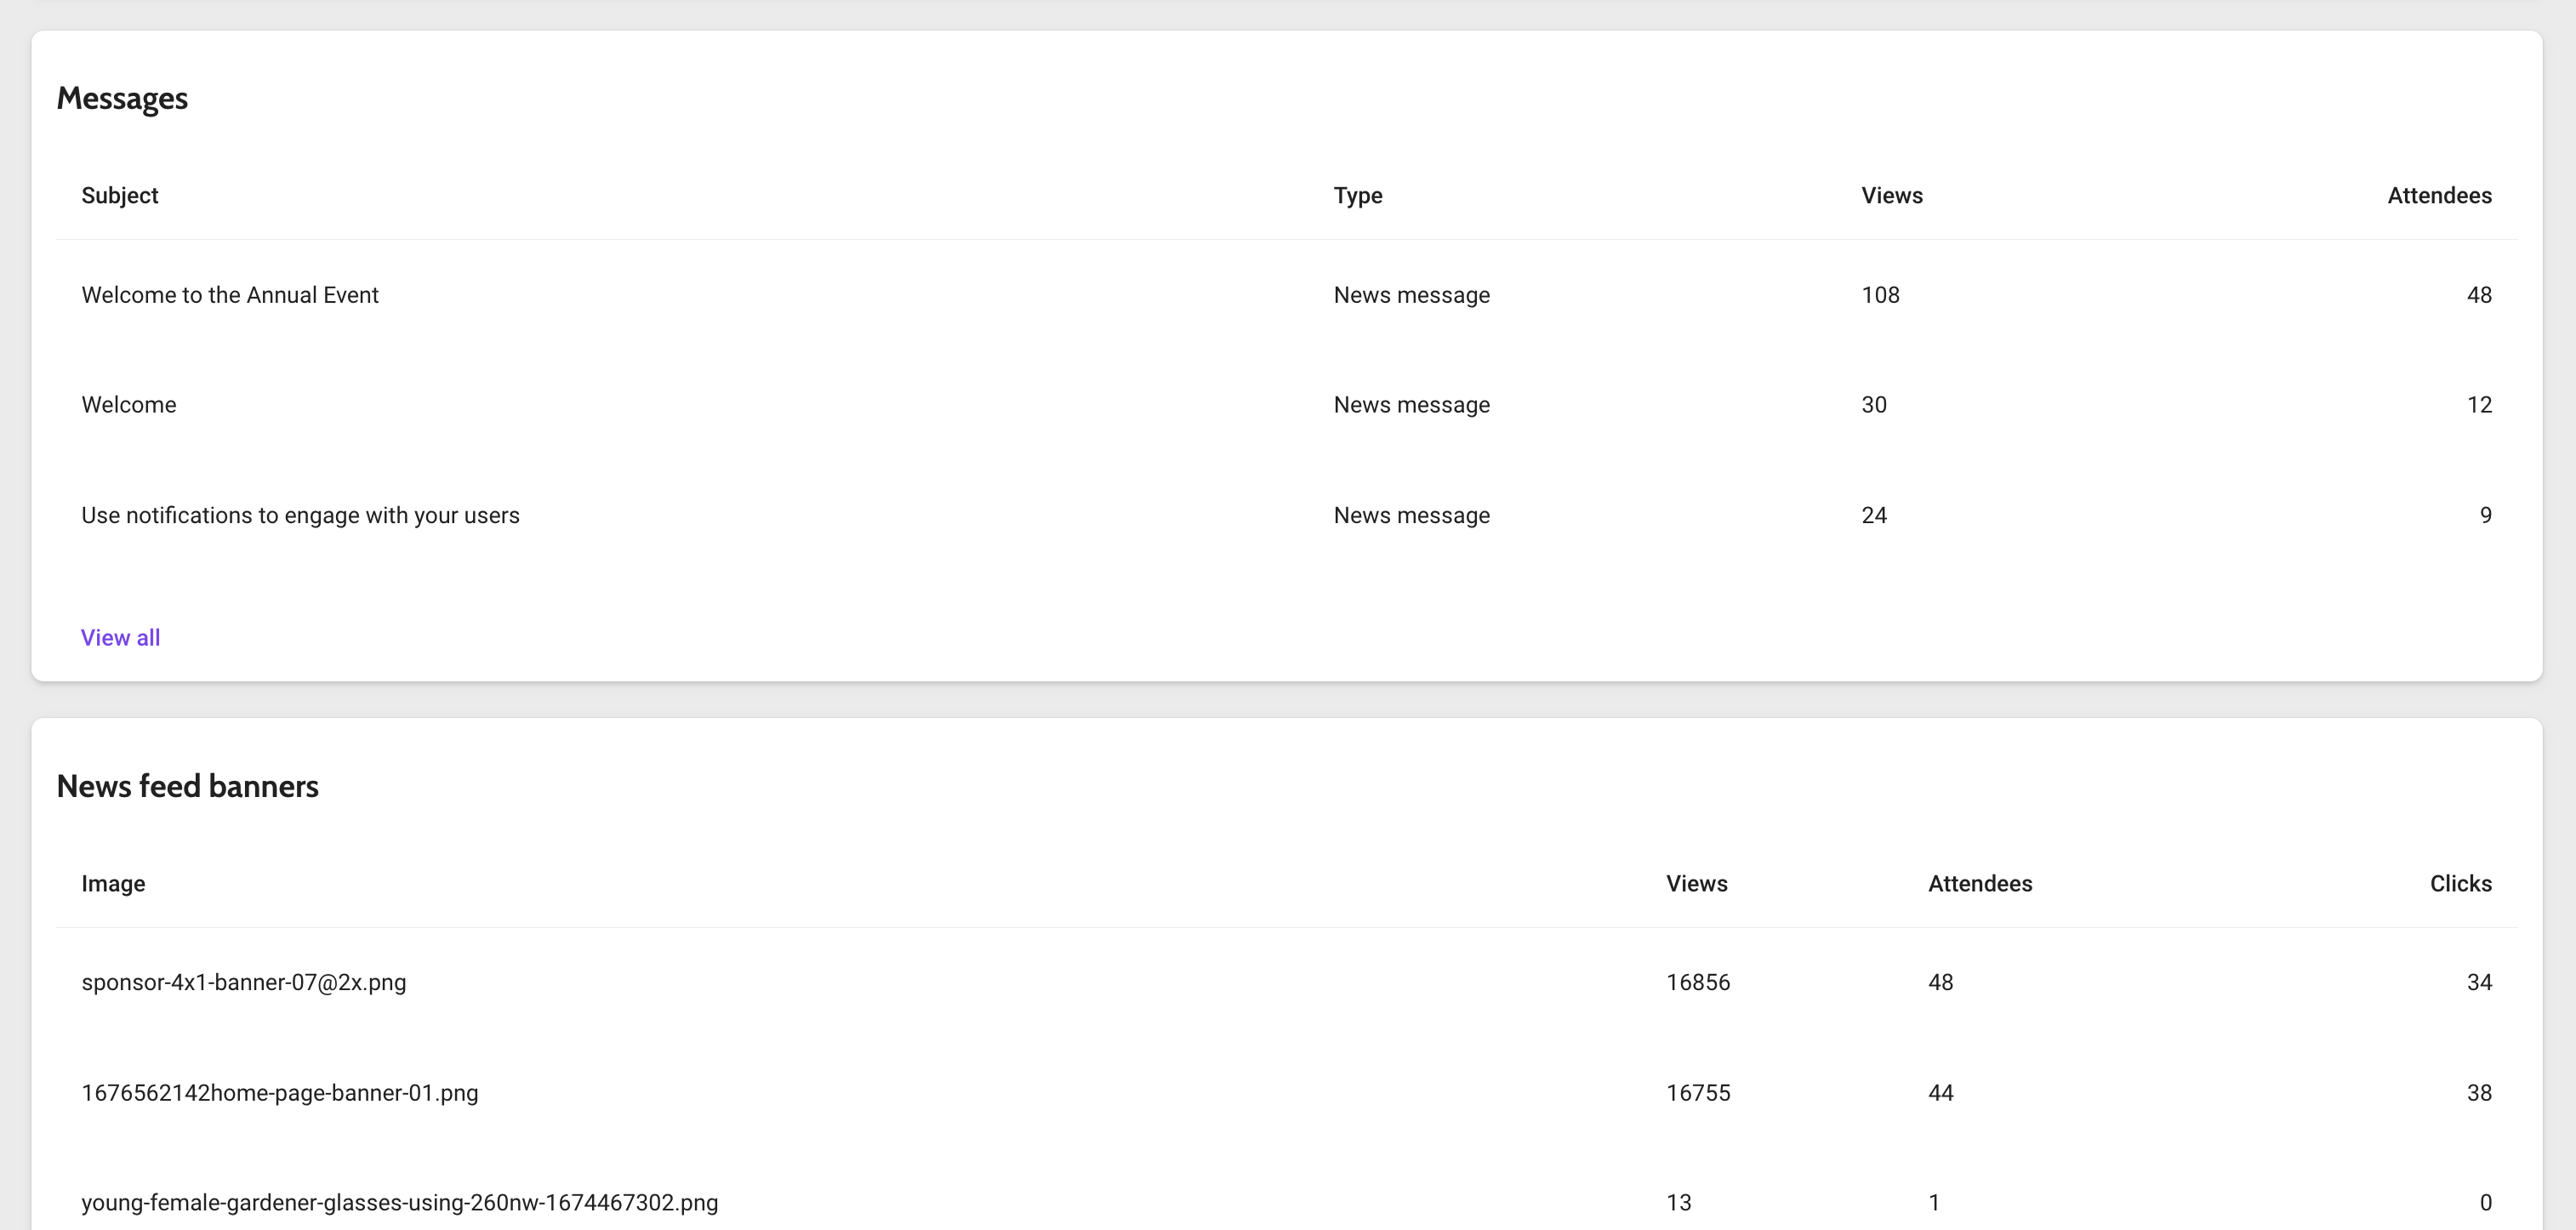
Feed
Messages: an overview of all news messages and targeted messages sent within the event, and by how many attendees they were viewed.
News feed banners: the number of views and clicks on the banner that is above the news feed in the web or mobile app.
Intro images and carousel images: if your mobile app has an intro or carousel page, you can find the number of views and clicks here. Please note that if you replaced your intro page at some point, the table will list both images separately.
Searches
If you have a general search page in your app, this tab lists all keywords that have been entered there. Please note that when using automatic search, also keywords entered only half are counted. If an attendee types slowly, you might then get both 'on', 'onco', 'oncolo' and 'oncology' in the results.
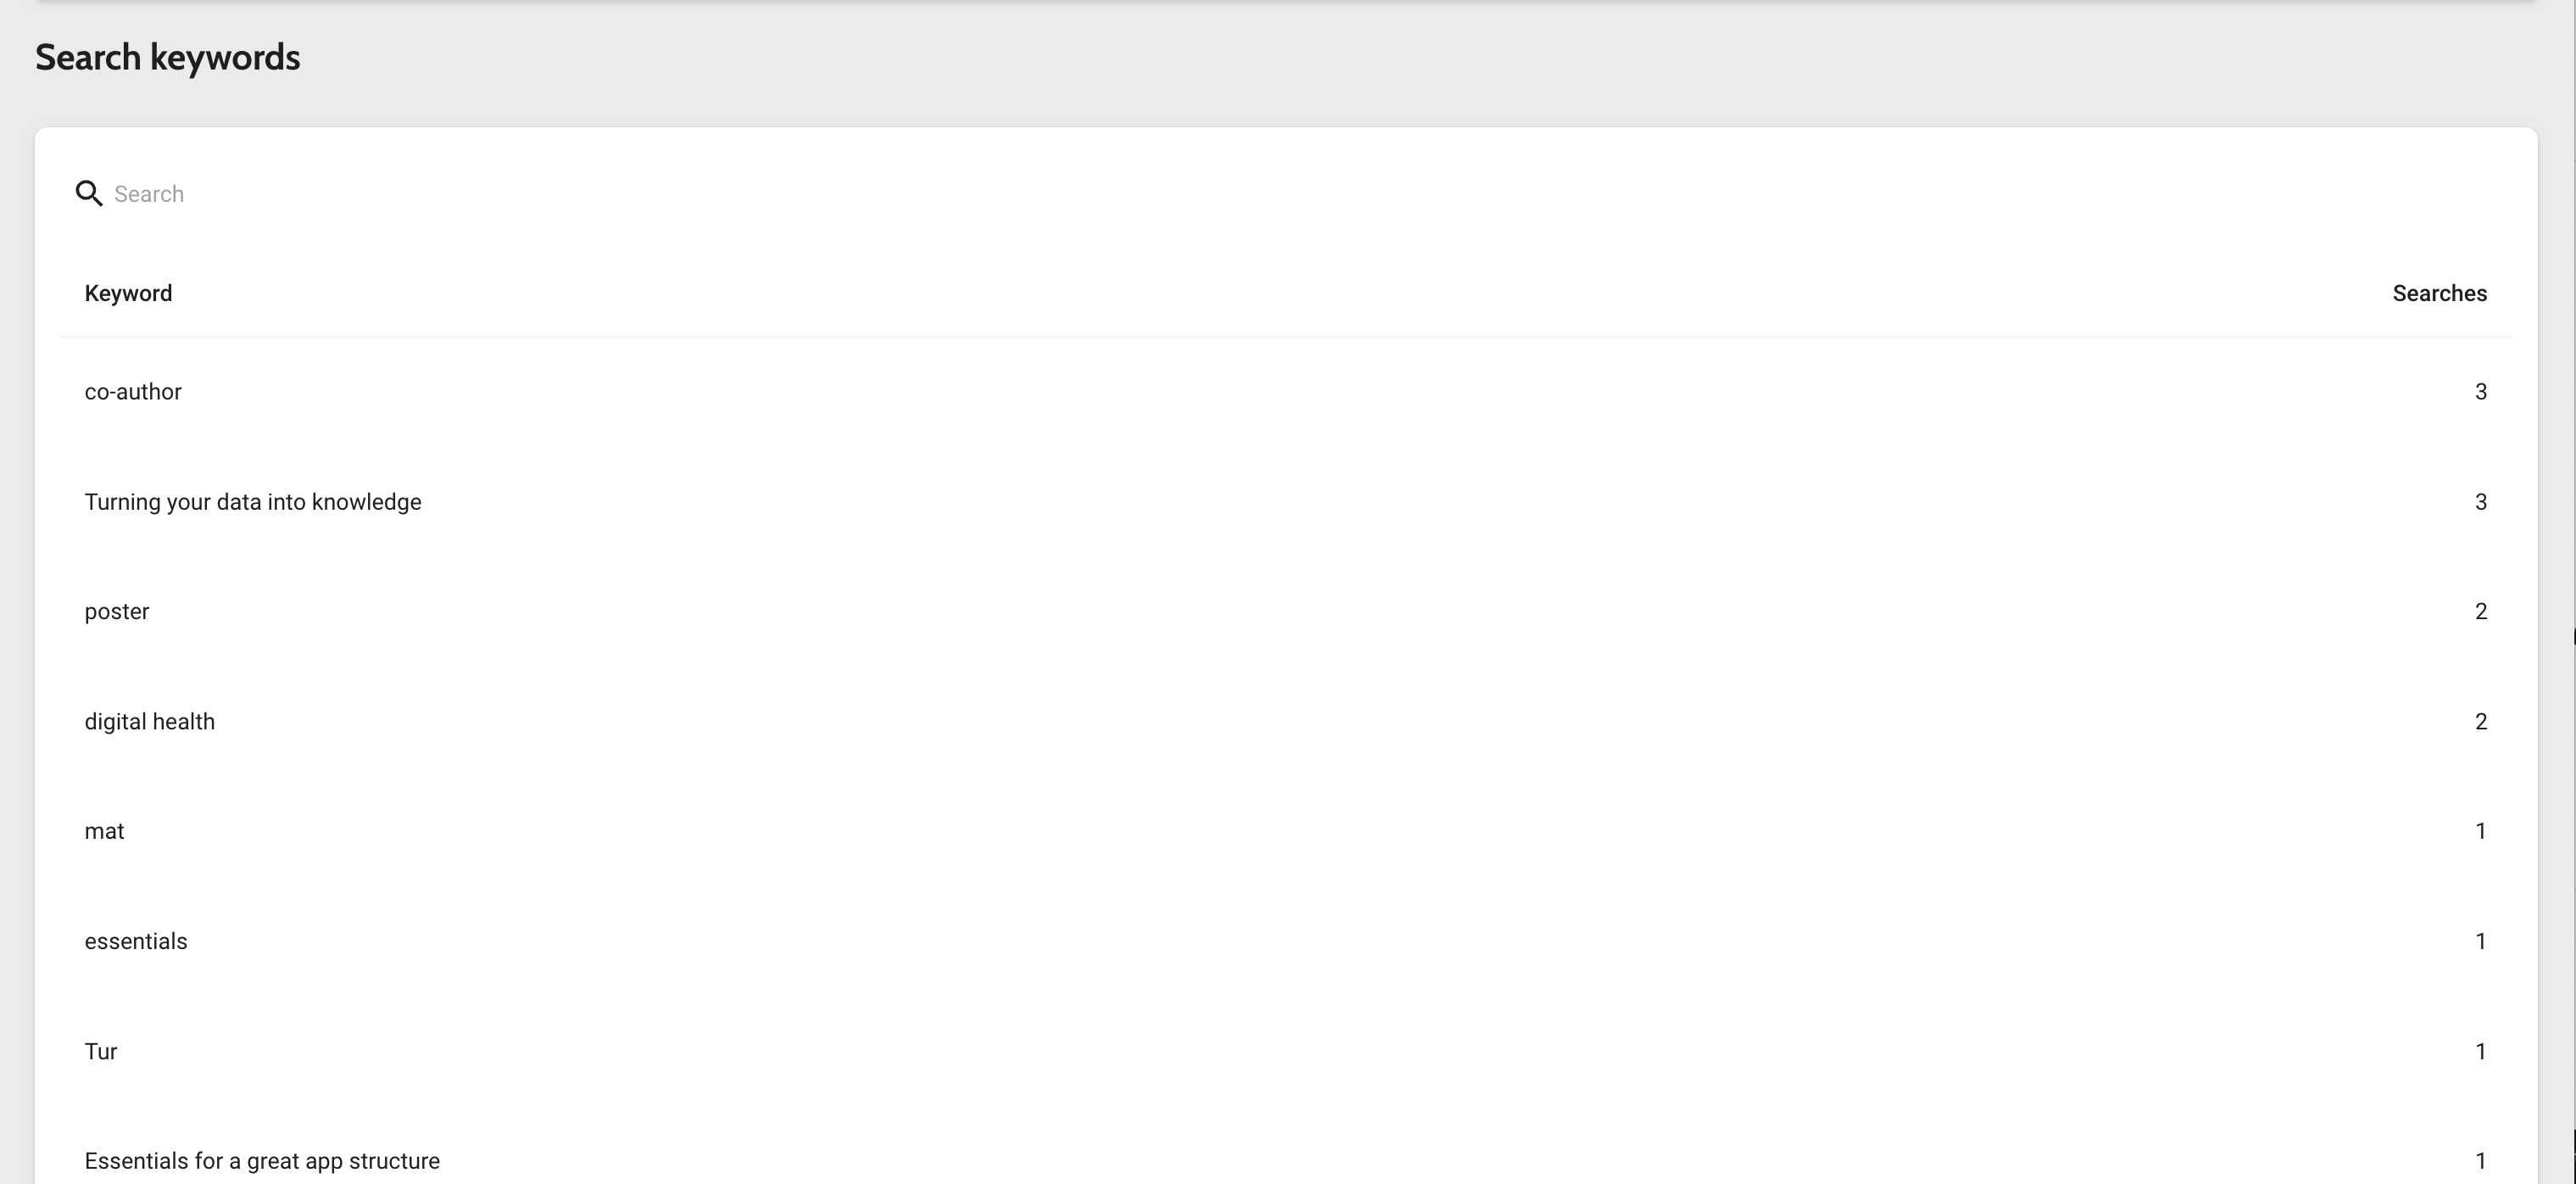
Tip! Check what your attendees are searching for, and use this info to improve the layout of your app.