The purpose of the analytics report is to give insights into the activity of the attendees.
Setting the date range
In the tab bar at the top, click the current period to change the date range of your report.

You can choose a period from a few presets or select a Custom date range with the date pickers. Click Apply to show the data.
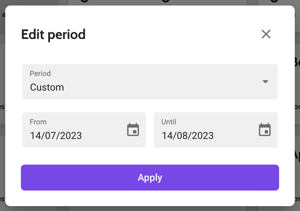
After the report has been generated, the dates in the tab bar are updated. This way you can see what date range your report is about if you visit the page later.
Export app report
In the purple, bar click the button Create report to download an Excel sheet with the app analytics of the selected period. You will first get a notification that the export started:
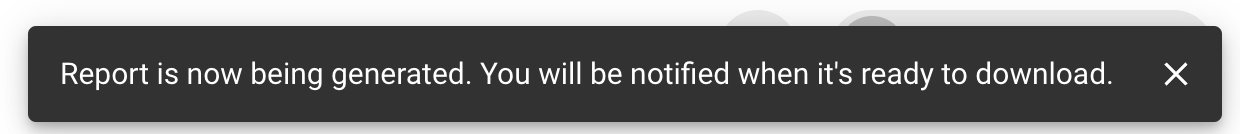
This is followed by an alert below the tab bar with the download link:

App installations & use
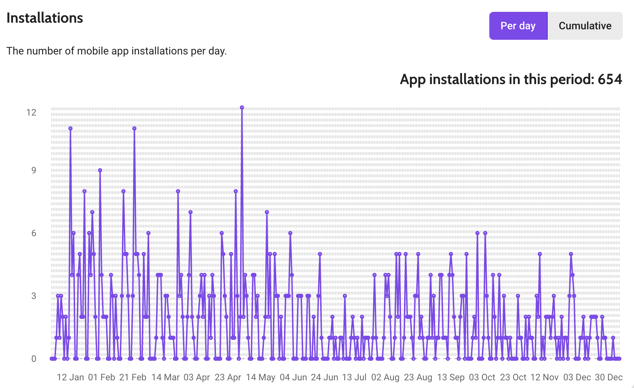
Installations
The graph shows you how many people installed the app in the selected period. You can choose to display the data per day, or to add up the installations of that day to a cumulative value.
Put your mouse pointer on the chart to see the number of app installations on that day.
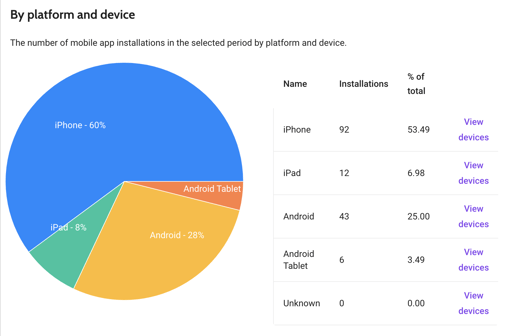
By platform & device
In this section, you can see how the app installations are distributed between iPhones, iPads and Android phones and tablets.
The full list of devices can be found in the popup that opens when clicking View devices. Please note that for iPhones, the ID is given, so not the model name. You can find the iPhone models these IDs translate to on Wikipedia below the Hardware strings.
Unique users
This graph shows you how many people used the app at least once during that day. Please note that if the same user uses the app twice, he or she will count as 1.
Put your mouse pointer on the chart to see the number of unique users on that day.
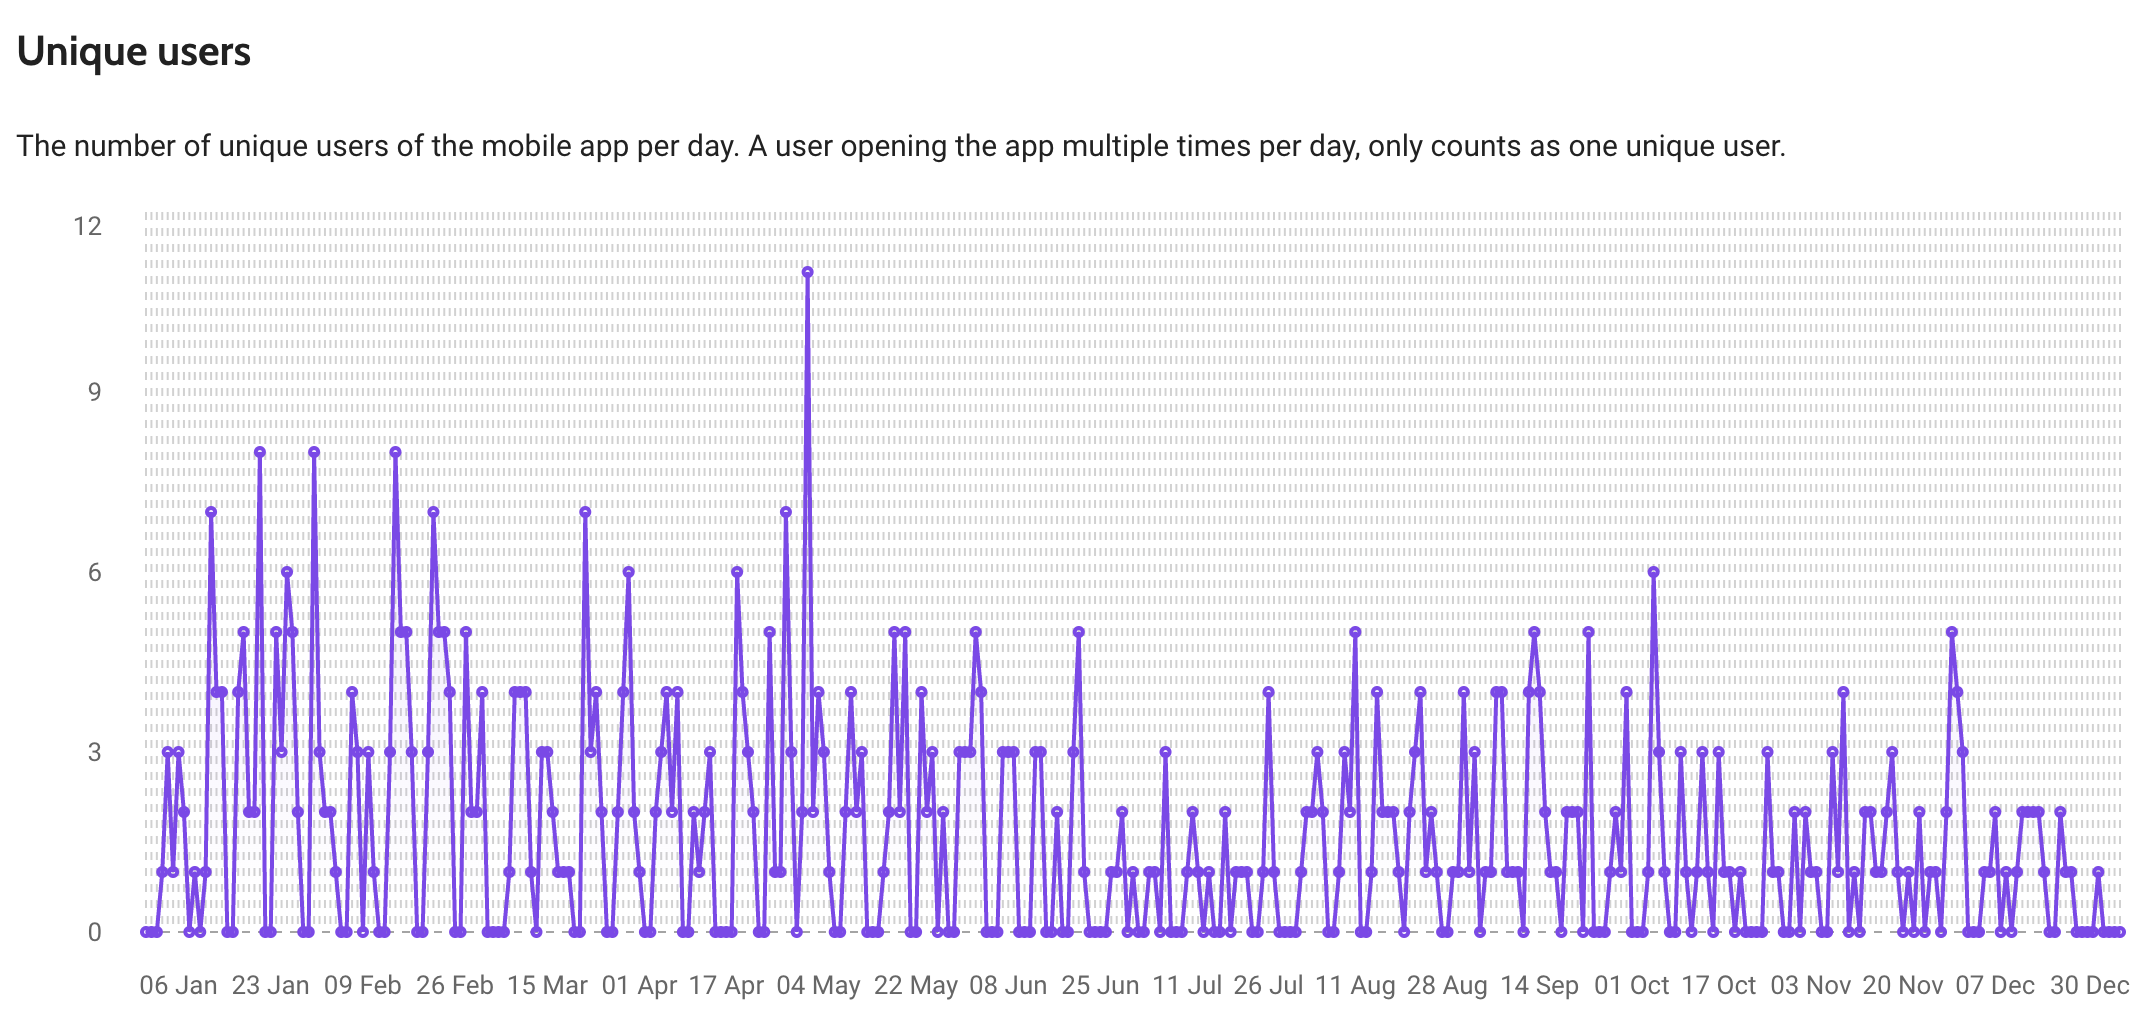
Note: The number of unique users can be higher than the number of installations. Some users might have installed the app before the selected period.
Pages
Here you can find how many times each tile on your society screen has been viewed. The following columns are available:
-
Name
-
Views: how many times the tile or modal has been viewed in total.
-
No. of users: how many attendees viewed the tile or modal in total.
-
Views per user: the average number of views per attendee.
-
% of users: the number of attendees that viewed the tile or modal divided by the total number of app installations in that period.
Use the Search to find a specific page.
The following page types are included: Event tiles, Info pages, News tiles, Topical chat tiles, Search, Notification centre, My profile (side menu), Edit profile, Contacts, Conversations, Settings, About this app.
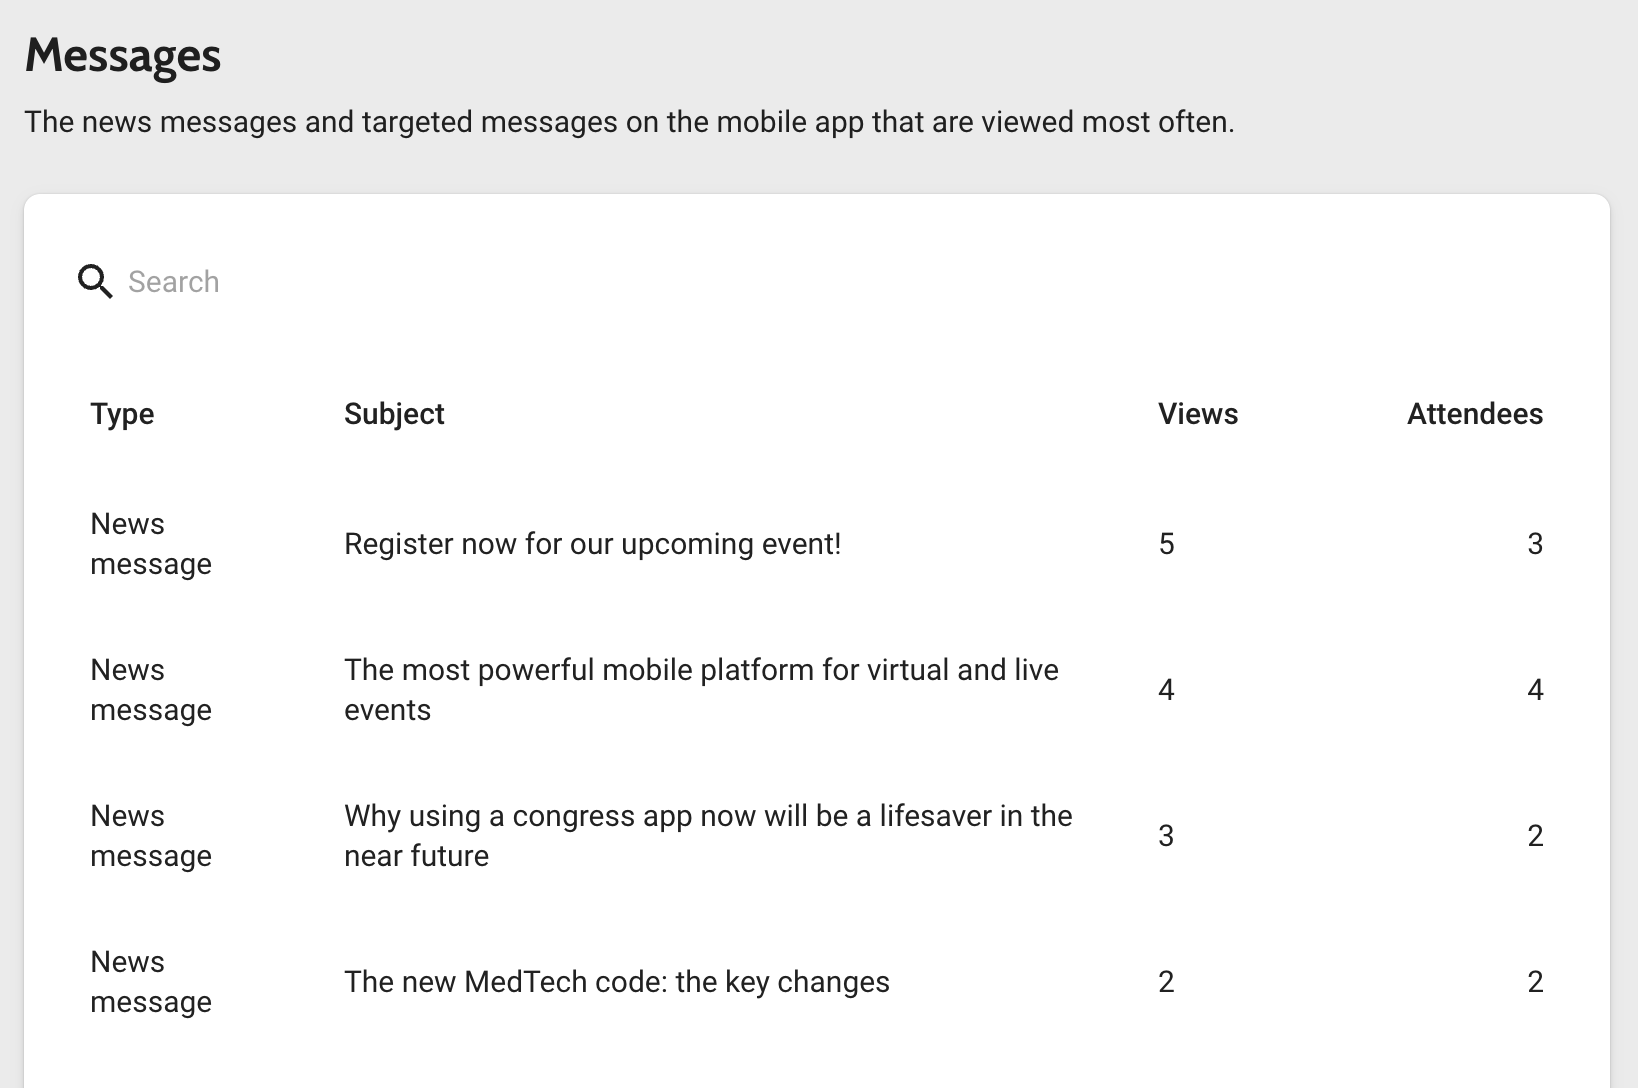
Messages
The table shows both news messages and targeted messages. Besides this Type, the following columns are available:
-
The Subject of the news message.
- The total number of Views in the selected period.
-
The total number of Users that have viewed the message.
Use the Search to find a specific message.